Gain valuable insights into your store’s performance with the Quotes Guru Analytics Report. This dashboard provides a comprehensive view of your quotes, customer preferences, and recent activity in one place. By tracking these data-driven insights, you can identify trends, understand customer behavior, and see which products are in high demand, ensuring your business stays one step ahead
To access the Analytic Page : #
- Go to the left side navigation
- and click on Analytics.

Key Features of Your Quote Analytics Dashboard: #
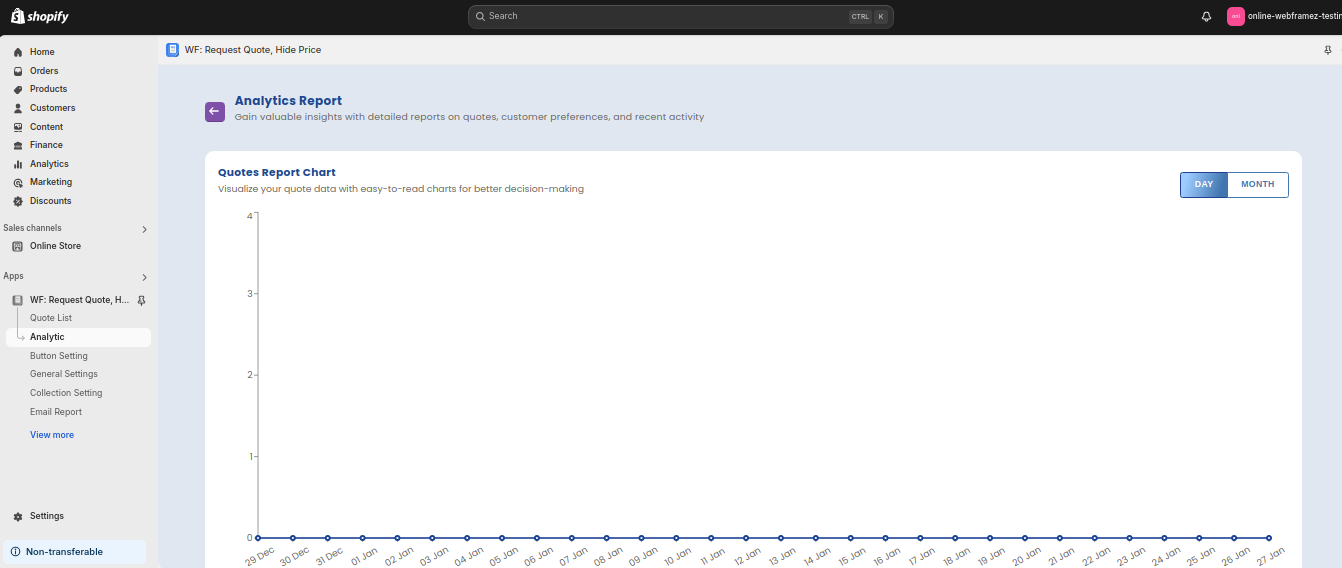
- Quotes Report Chart
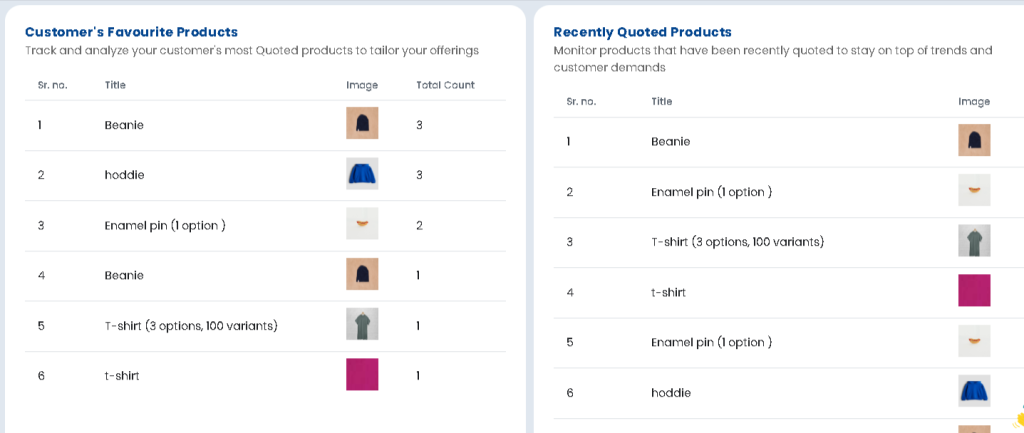
Visualize your quote data with easy-to-read charts. This feature enables you to track your quoting activity over time, compare quote success rates, and make better-informed decisions to optimise your quoting strategy. - Customer’s Favourite Products
Stay connected with your customers’ preferences by tracking their most Quoted products products. This insight allows you to tailor your offers and promotions based on what they select the most, giving your customers a more personalised shopping experience. - Recently Quoted Products
Monitor the products that have been recently quoted. This feature gives you a real-time view of which items are generating the most interest, helping you understand customer demand and adjust your product listings or inventory accordingly.
With the Analytics Report, you can make smarter business decisions and refine your approach to quoting and customer engagement, ultimately boosting efficiency and customer satisfaction.


